


Boston Airbnb Listings Exploratory Analysis
This blog is a part of Udacity Data Scientist Nanodegree. Do check out the references section to deep dive into the code for deeper analysis.


Airbnb is an online website/application offering rooms, lodgings and homestays all over the world. Airbnb provides travellers with a unique and personalized way of experiencing new places and socializing with local people. This is what sets them apart from the basic, run of the mill hotels/inns that travellers usually stay in.
This dataset describes the listings on Airbnb for the city of Boston. It has all the details about the listings, hosts and also some metrics to analyse the user behaviour and draw conclusions from it.
Here we take into account some questions that would help us analyse user behaviour like -
First we just generally take a look at the data and run some basic housekeeping commands to get a feel of the data. Basic stuff like data exploration, null coverage and the correlation matrix to visualize and filter out the important features of the dataset.
Then we dive deeper into the data to see what are the common amenities provided in the homestays across Boston.
Further, we analyse how these amenities affect the popularity of the property. Also, we look at what other features attract the guests to rent a property.
Finally, using the property's geolocation coordinates, we see how the location of the property affects its price. We do this by training a linear model on the data and then analysing the coefficients of the model to analyse which features affect the listing price and by what factor.
Without further ado, let's dive into answering these questions -
1. Data Exploration
On a very high level, we can observe the data hs very detailed information pertaining to the various listings on Airbnb across Boston.
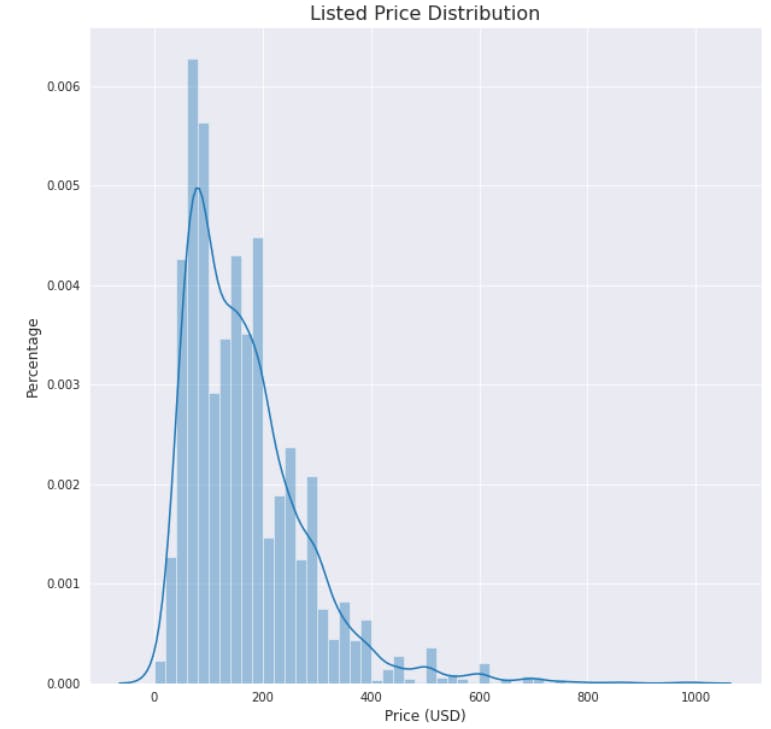
As is evident from the distribution above, most of the listings lie in the range below 200 USD. Which makes sense, considering the cost of living in Boston. As we move higher, the property count decreases drastically, these must be the homestays catering to premium travellers.
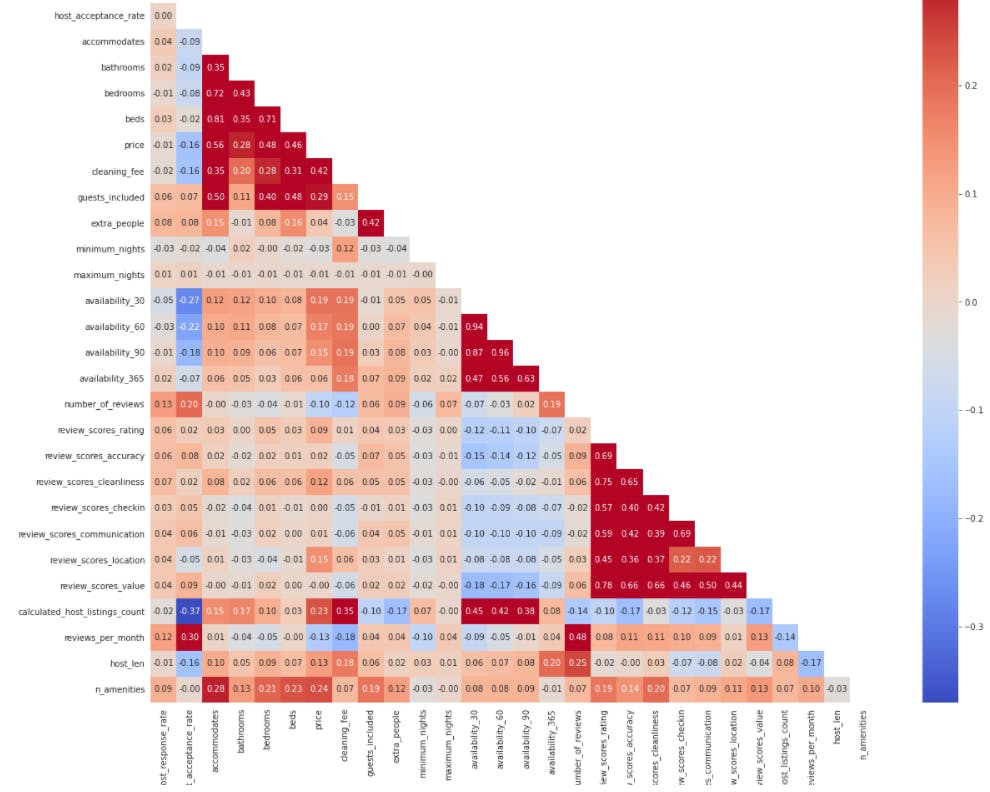
Then we created a correlation matrix to analyse how different features affect each other. If we see the price column, we can find that amenities have a very high correlation to the price of the listing. Apart from that looks like the cleaning fee is closely related to price but doesn't seem that they share a causal relationship, still we will look into this later.
2. Let's dive deeper into the data to see what are the common amenities provided in the homestays across Boston.
As was evident from the corelation matrix, amenities and price are related closely. Here we take a look at most common amenities in the dataset.
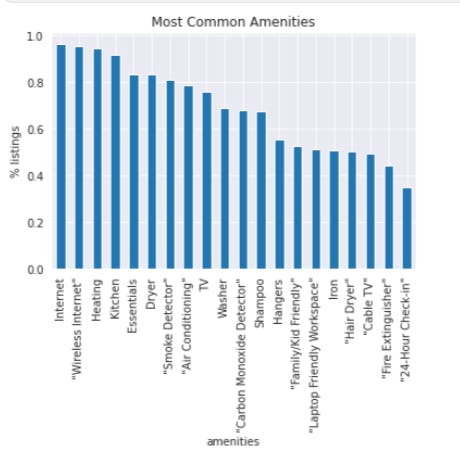
From what we gathered, the most common amenities in the dataset are -
- Internet
- Wireless Internet
- Heating
- Kitchen
- Essentials
- Dryer
3. Further, we analyse how these amenities affect the popularity of the property. Also, we look at what other features attract the guests to rent a property.
For property type, we saw that the booking rate varied with the property type feature. Having the most bookings for villas as compared to the lesser popular dorms/apartments.
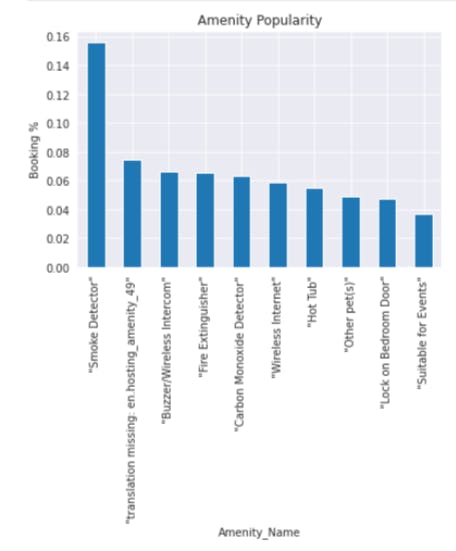
Coming back to amenities, for some reason, smoke detectors seem to be a necessity while looking for Airbnbs in Boston. Boston travellers do like to put safety first. Other amenities also affect booking rate, the numbers do start dwindling for the more premium amenities like hot tubs and bedroom locks.
Q4. Finally, using the property's geolocation coordinates, we see how the location of the property affects its price. We do this by training a linear model on the data and then analysing the coefficients of the model to analyse which features affect the listing price and by what factor.
For observing how these features affect the price of a listing we trained a simple linear model on the dataset.
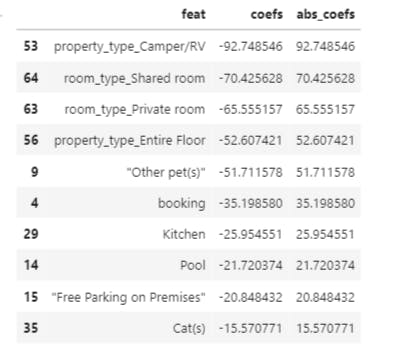
The table shows the various features and by what factor they influence the listing price. We observe that property type plays a major role in the listing price. Then we have the various essential amenities that make the listing price go up.
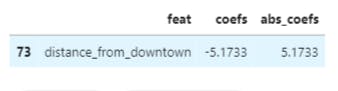
The distance of the listing from Boston downtown does have some effect on the price but does not contribute much to the listing price.
Thanks for making it till the end! If you'd like to dive deeper in how I came to answer these questions, checkout the git repo in references below.